ETF Landscape in India
The Indian ETF market has grown significantly in recent years, offering investors a wide range of options across different asset classes and investment strategies.
Index ETFs
IndexTrack major indices like Nifty 50, Sensex, and Nifty Next 50. Generally have the lowest expense ratios and tracking errors.
Sector ETFs
SectorFocus on specific sectors like Banking, IT, PSU. Offer targeted exposure to high-growth sectors of the Indian economy.
Debt ETFs
DebtInclude Liquid ETFs and G-Sec ETFs. Provide stable returns with lower volatility compared to equity ETFs.
Bullion ETFs
BullionTrack precious metals like Gold and Silver. Serve as effective inflation hedges and portfolio diversifiers.
Factor ETFs
FactorFollow specific investment factors like Momentum and Low Volatility. Offer strategic exposure to specific market factors.
Global ETFs
GlobalProvide exposure to international markets like S&P 500, NASDAQ, Hang Seng. Enable geographical diversification.
Expense Ratio Analysis
Expense ratio is a critical factor in ETF selection as it directly impacts returns. Lower expense ratios are generally preferable as they reduce the cost of investment.
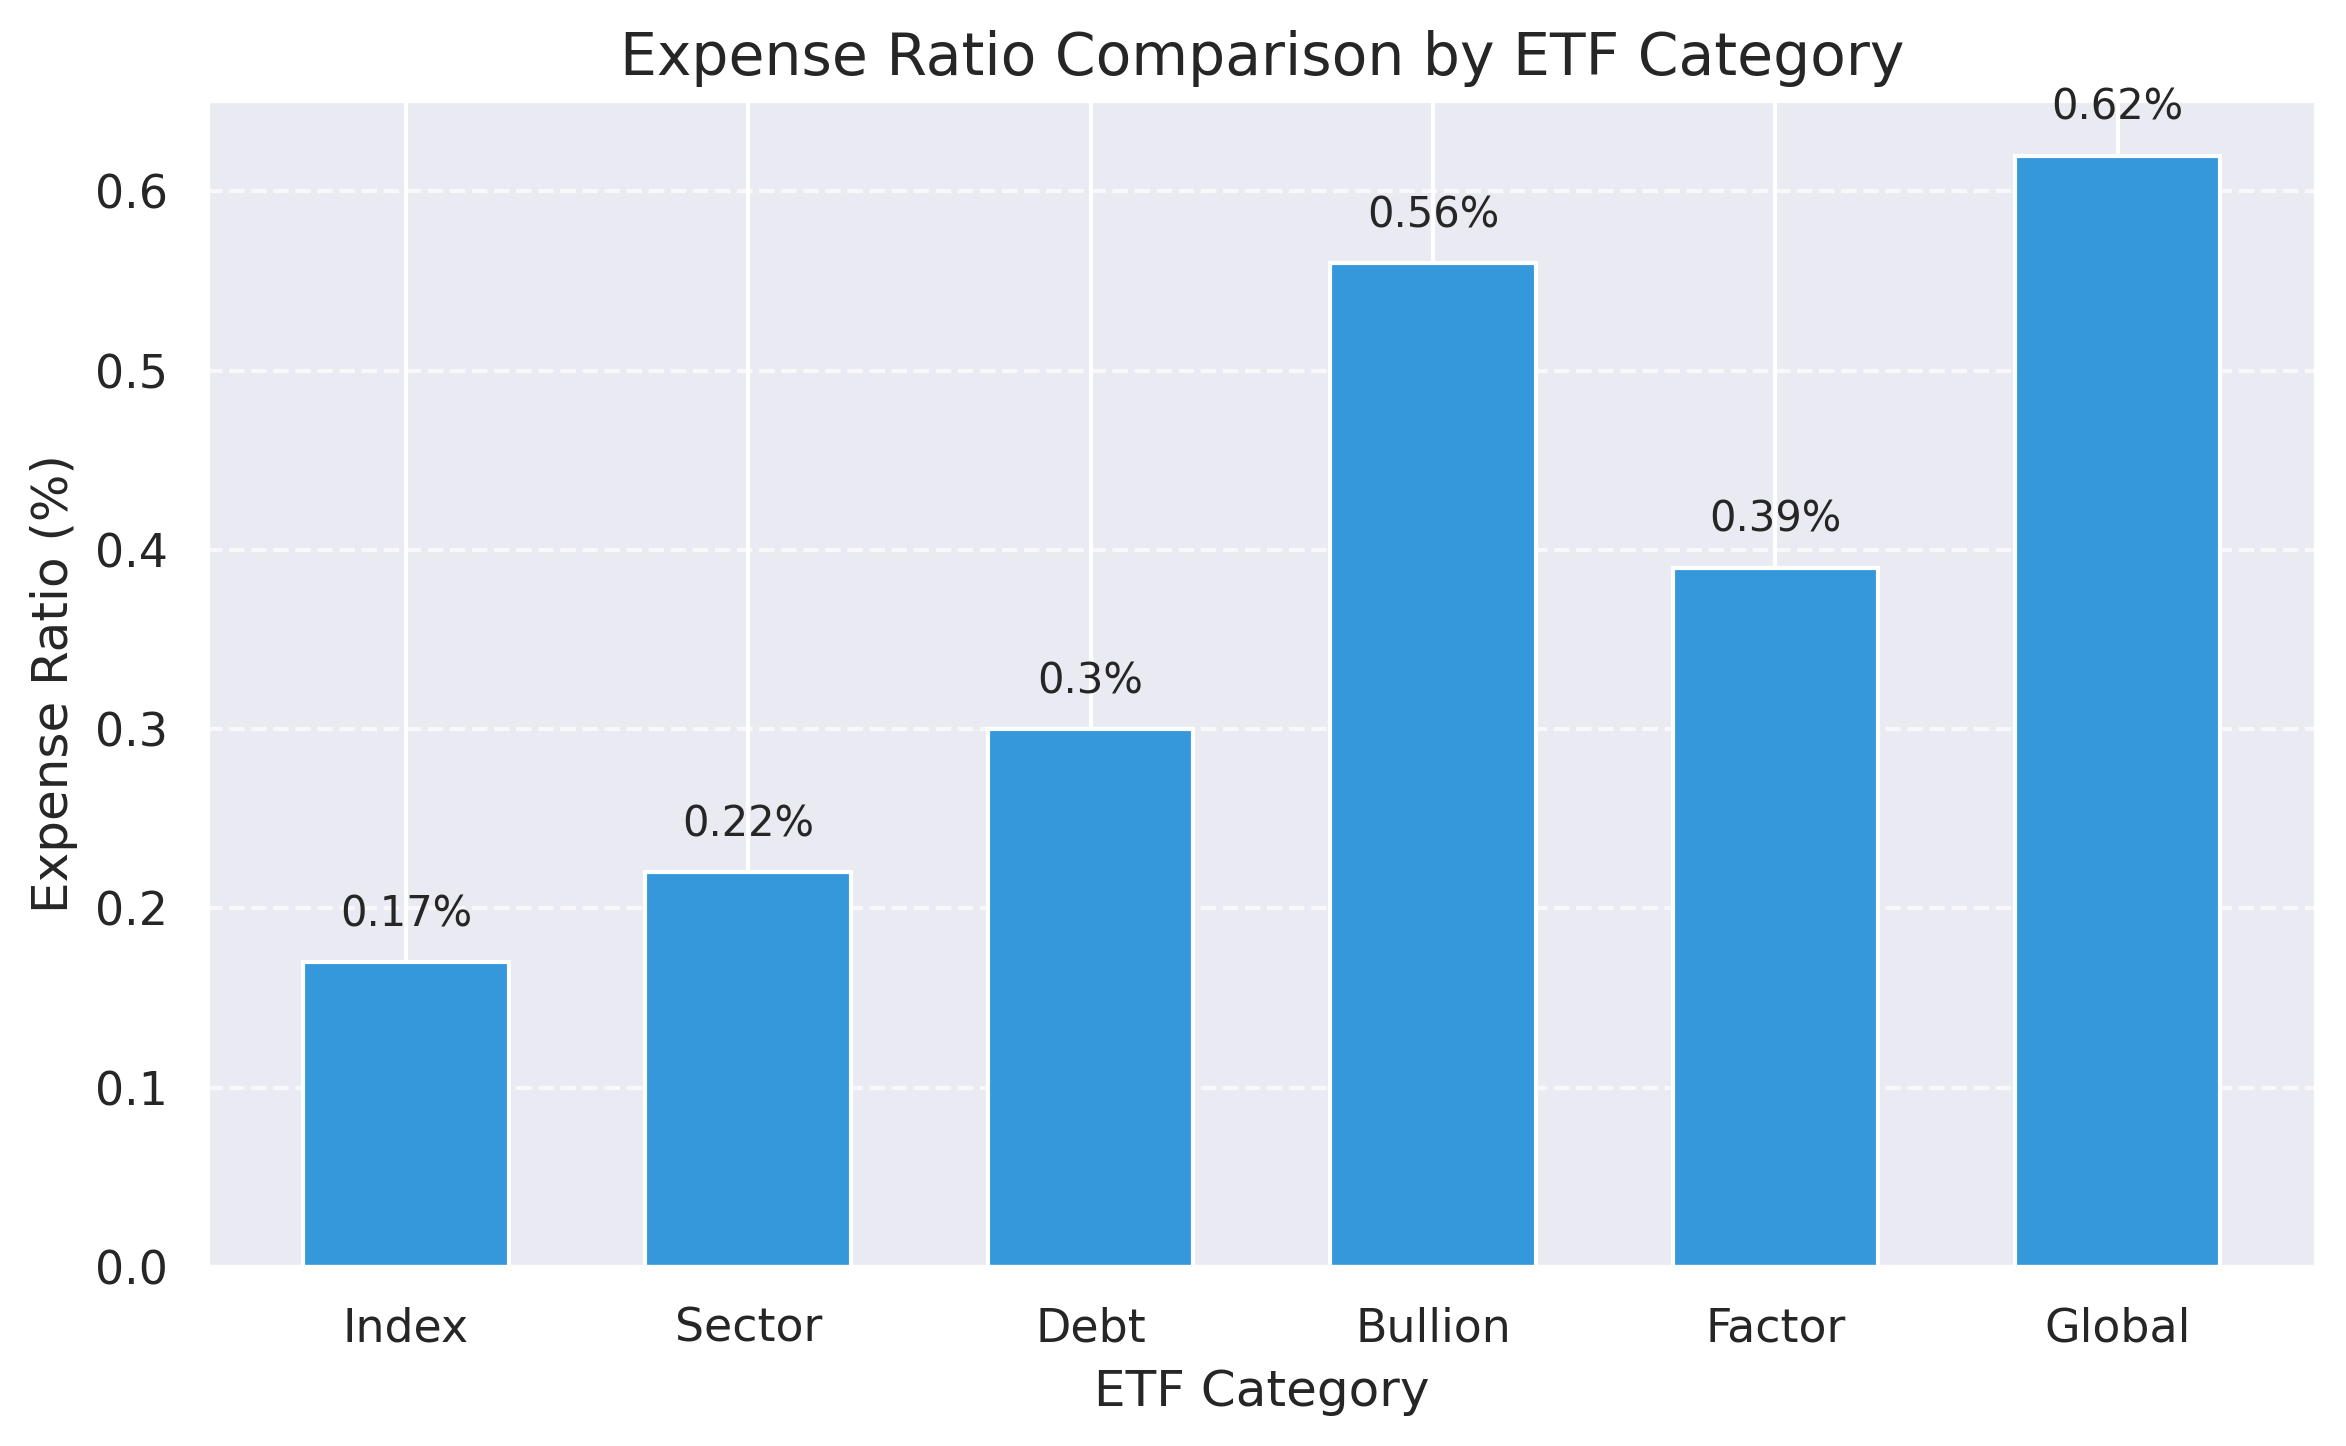
Key Observations:
- Index ETFs generally have the lowest expense ratios, with some funds charging as little as 0.03%
- Bullion ETFs and Global ETFs tend to have higher expense ratios
- Debt ETFs show moderate expense ratios with significant variation between funds
Expense Ratio Ranges by Category
| Category | Minimum | Median | Maximum |
|---|---|---|---|
| Index | 0.03% | 0.17% | 0.41% |
| Sector | 0.07% | 0.22% | 0.39% |
| Debt | 0.25% | 0.30% | 0.69% |
| Bullion | 0.50% | 0.56% | 0.82% |
| Factor | 0.30% | 0.39% | 0.41% |
| Global | 0.58% | 0.62% | 0.93% |
Performance Analysis
Historical returns across different time periods provide insights into ETF performance consistency.
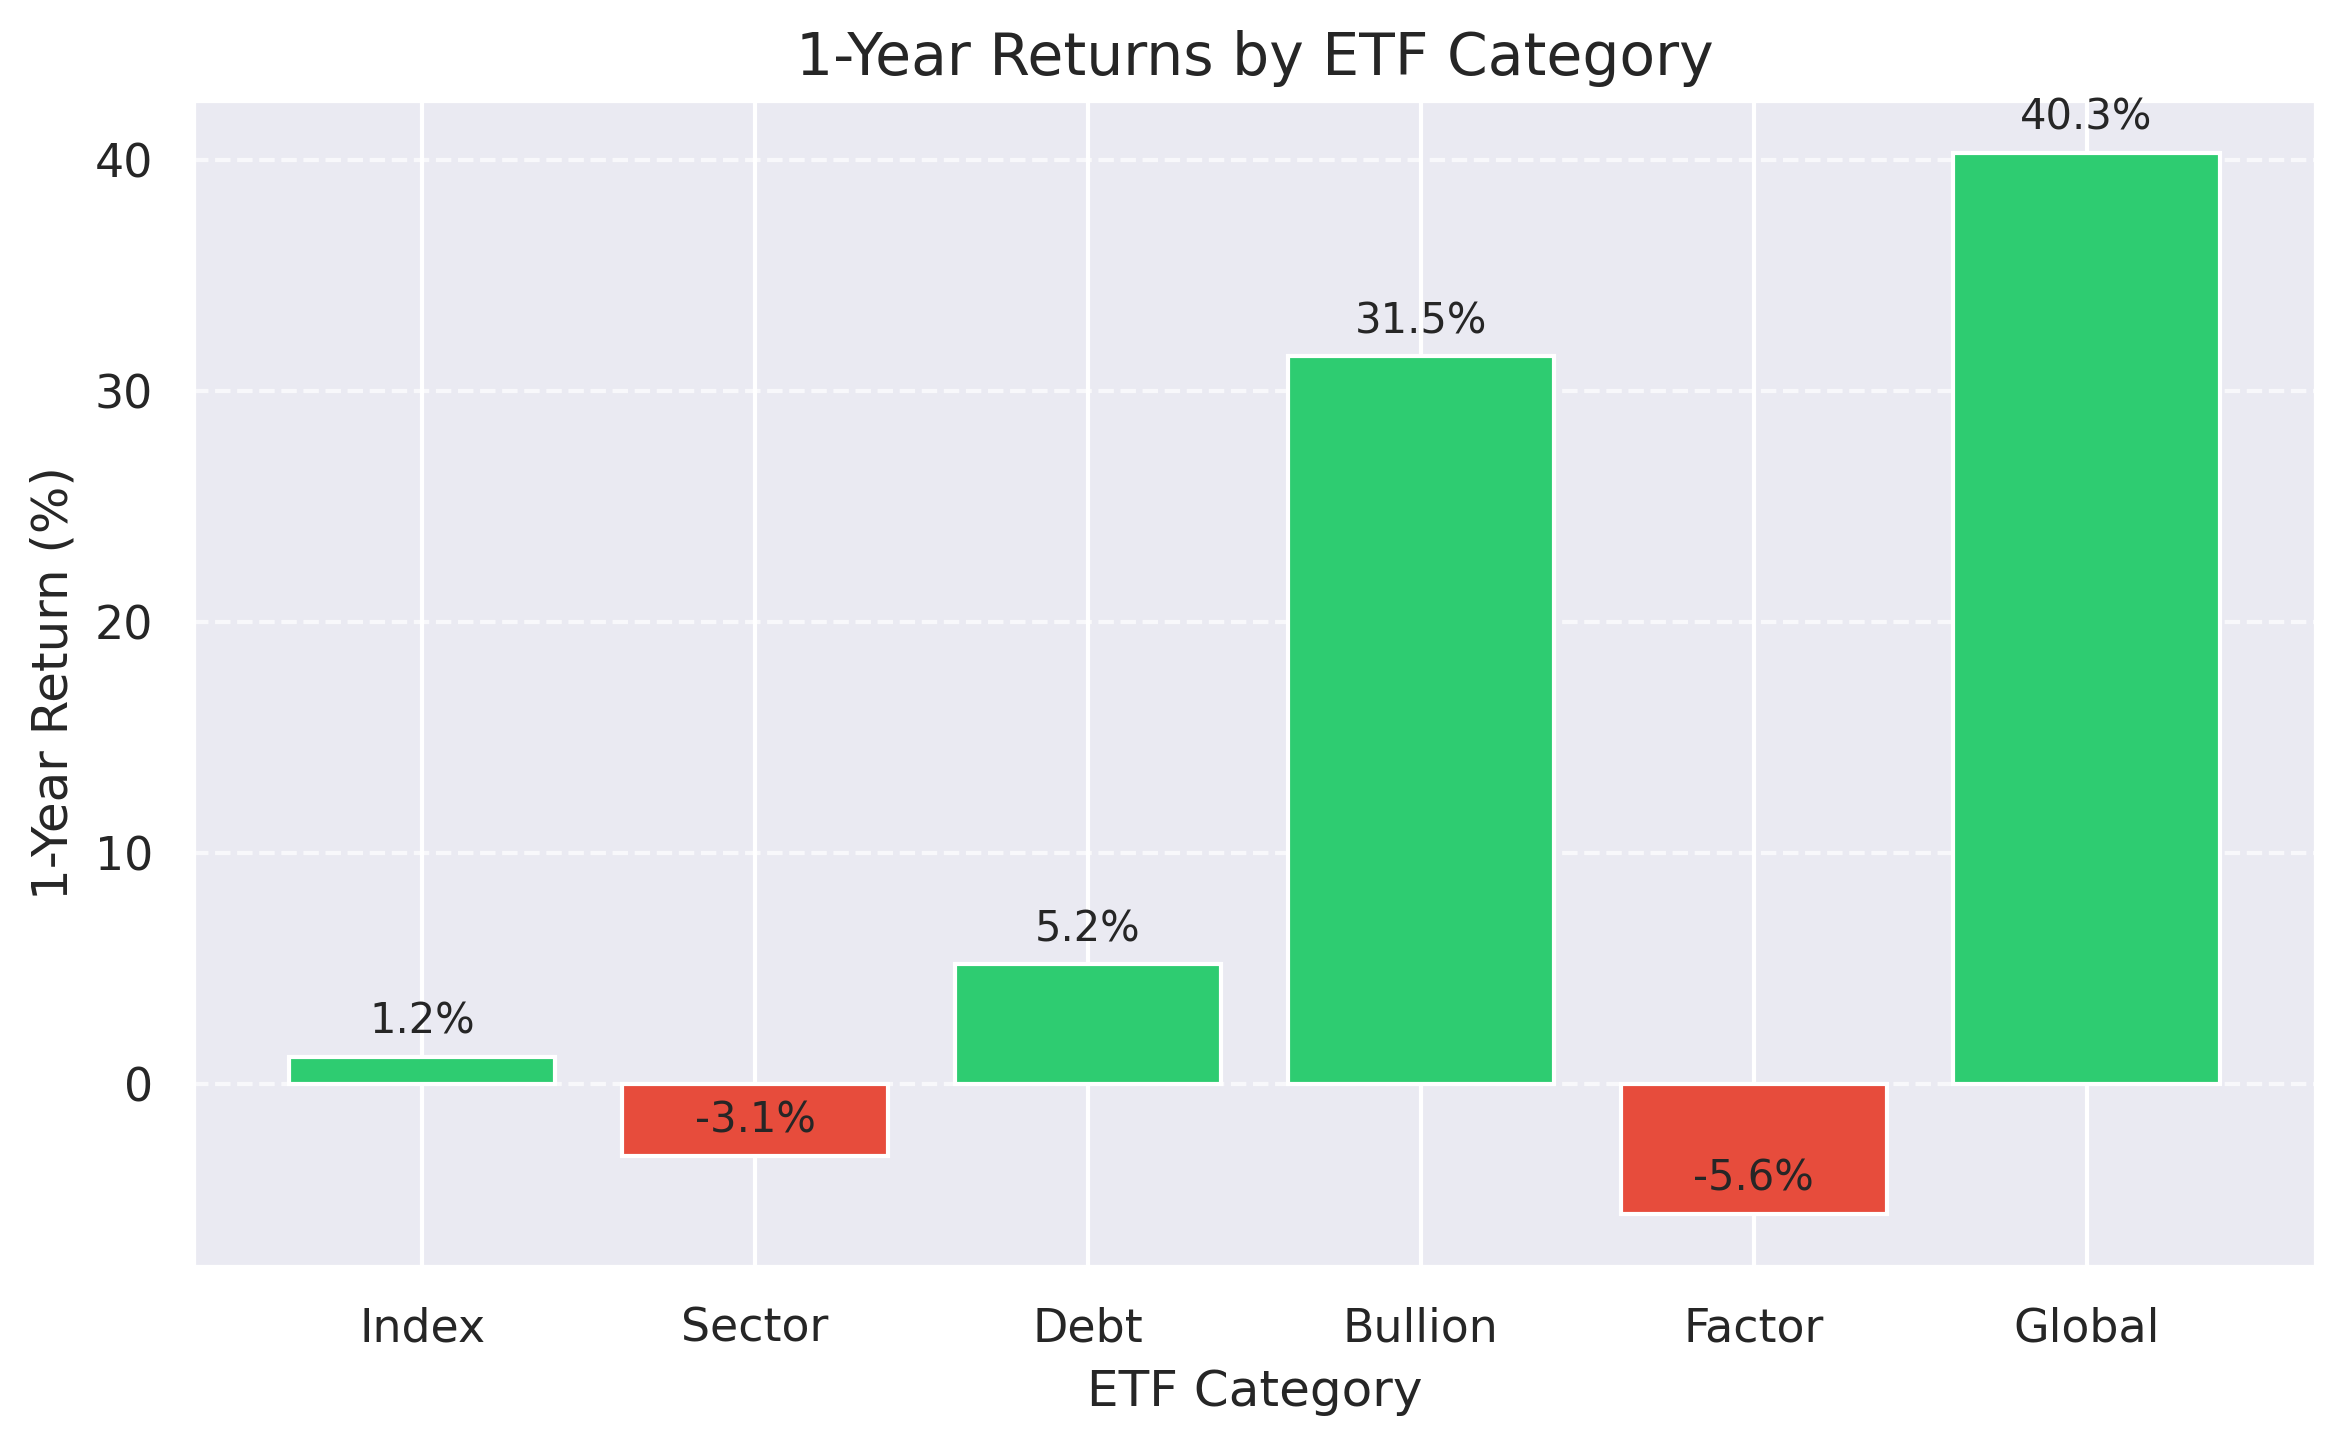
Key Observations:
- Global ETFs and Bullion ETFs have shown exceptional 1-year returns
- Sector ETFs demonstrate strong 3-year and 5-year performance
- Factor ETFs show mixed short-term performance but better long-term results
- Debt ETFs provide stable but modest returns across time periods
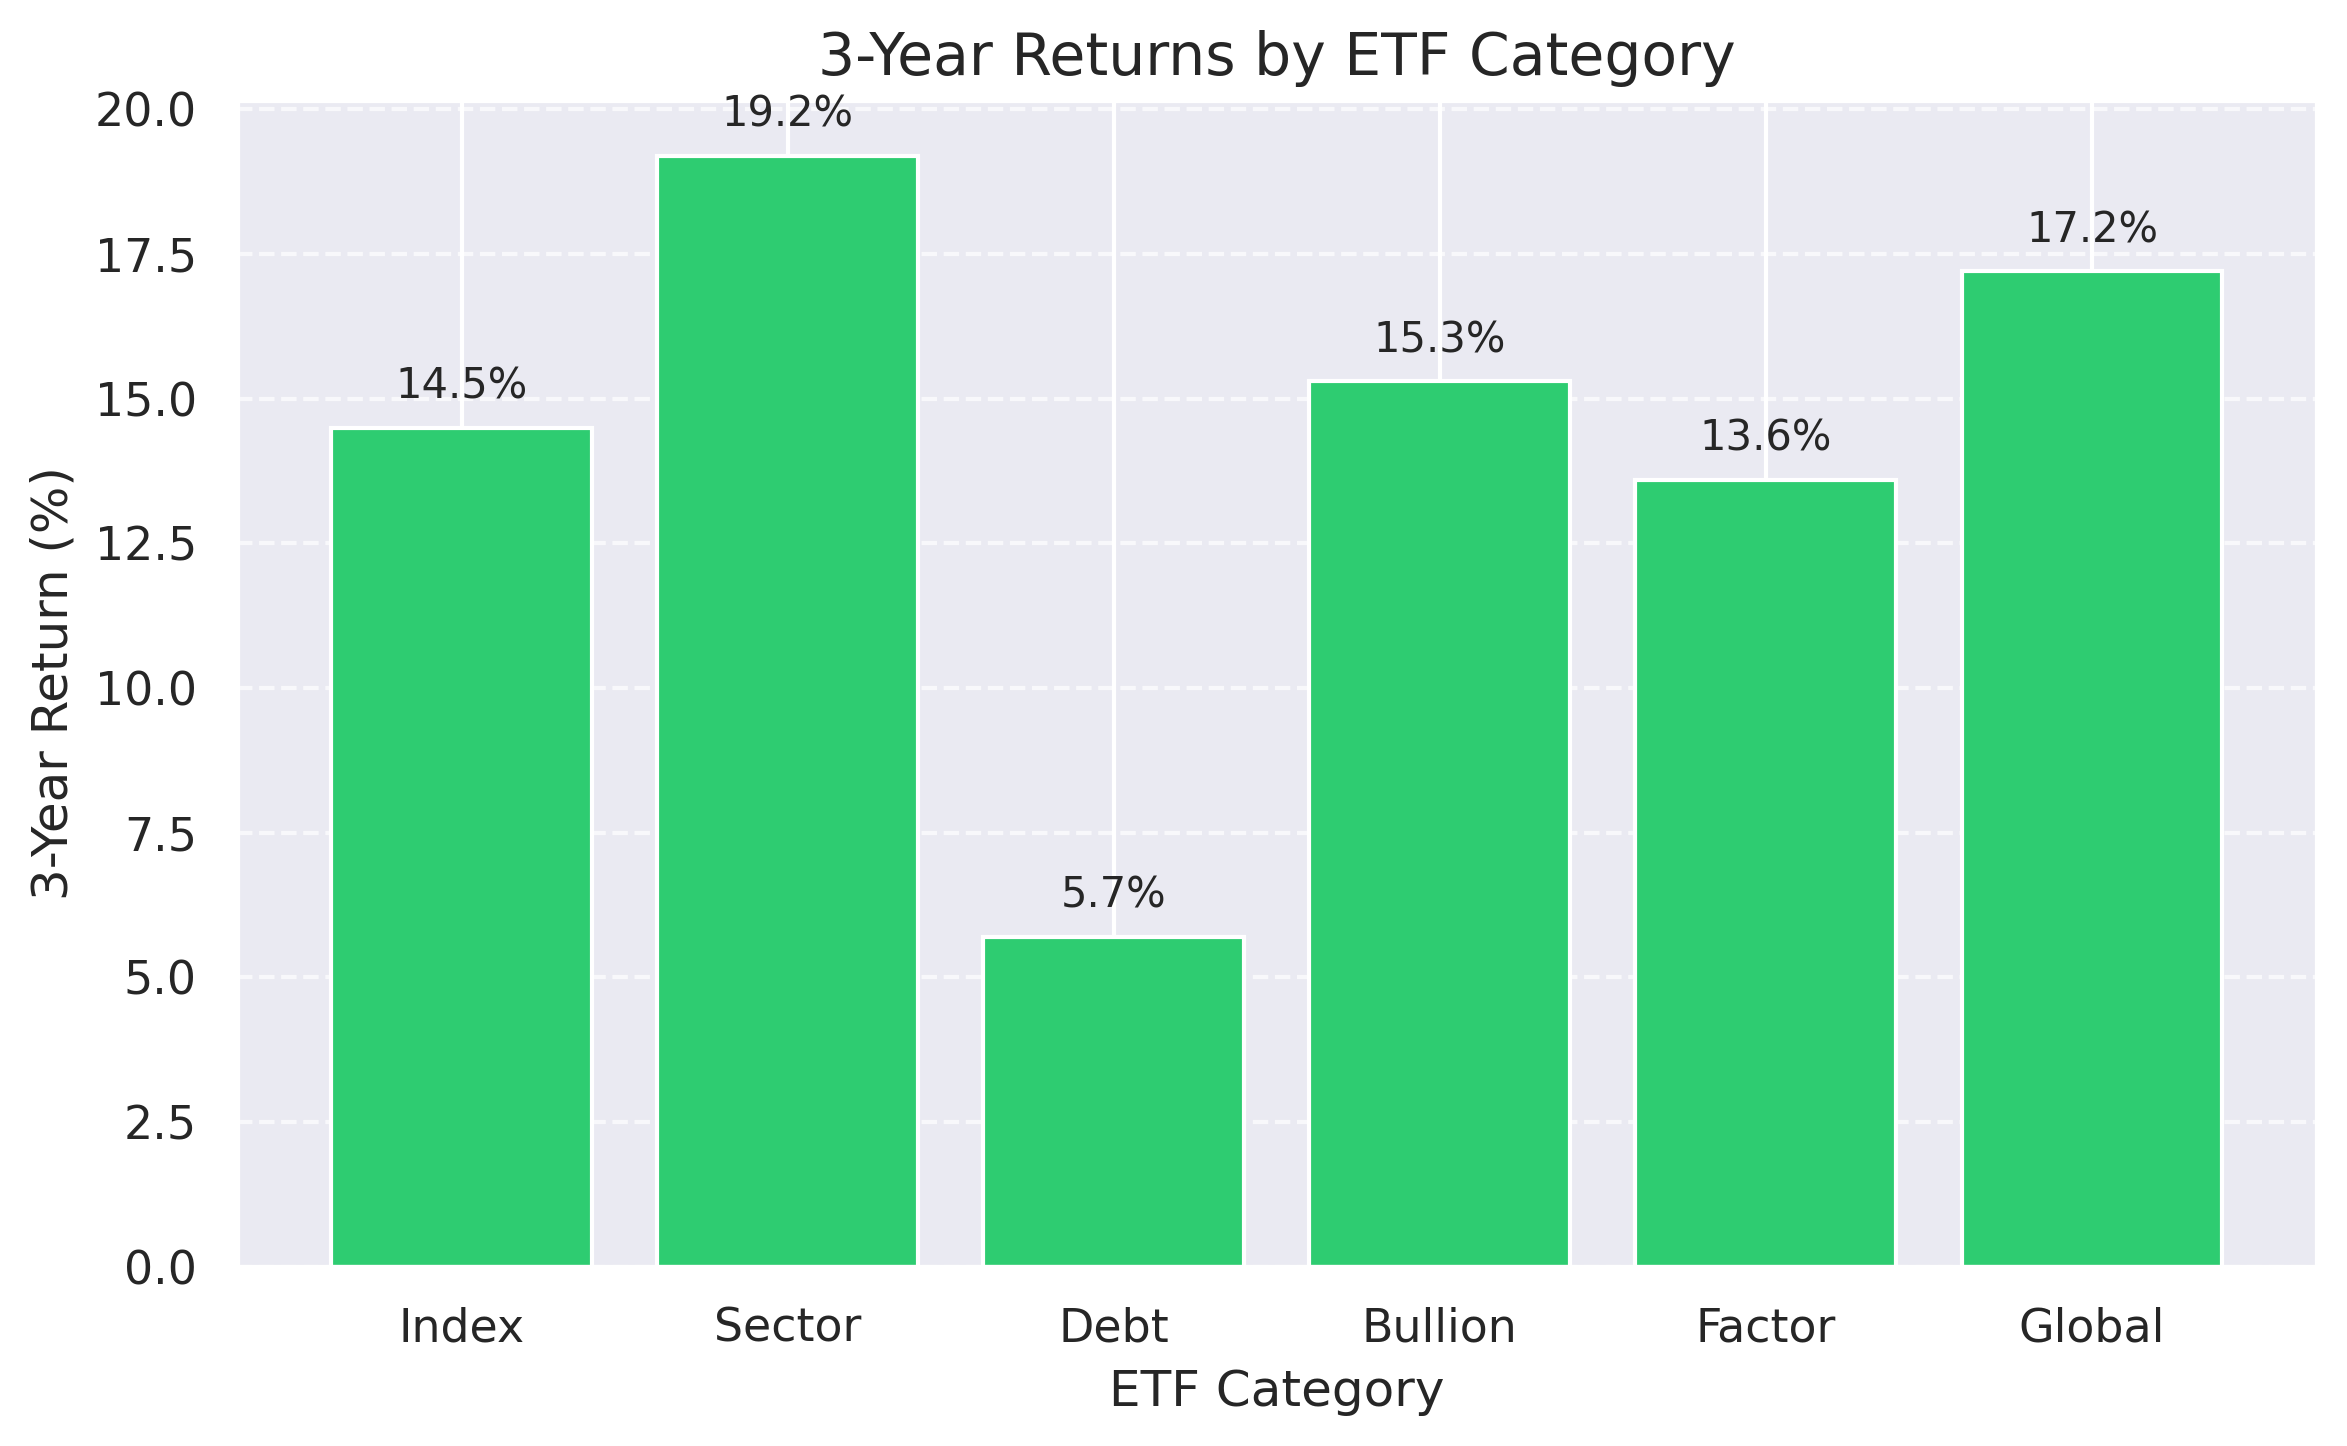
Average Returns by Category
| Category | 1-Year | 3-Year | 5-Year |
|---|---|---|---|
| Index | 1.2% | 14.5% | 16.2% |
| Sector | -3.1% | 19.2% | 21.7% |
| Debt | 5.2% | 5.7% | 4.0% |
| Bullion | 31.5% | 15.3% | 12.8% |
| Factor | -5.6% | 13.6% | 17.9% |
| Global | 40.3% | 17.2% | 13.8% |
Risk Analysis
Understanding risk metrics helps investors assess the volatility and market sensitivity of ETFs.
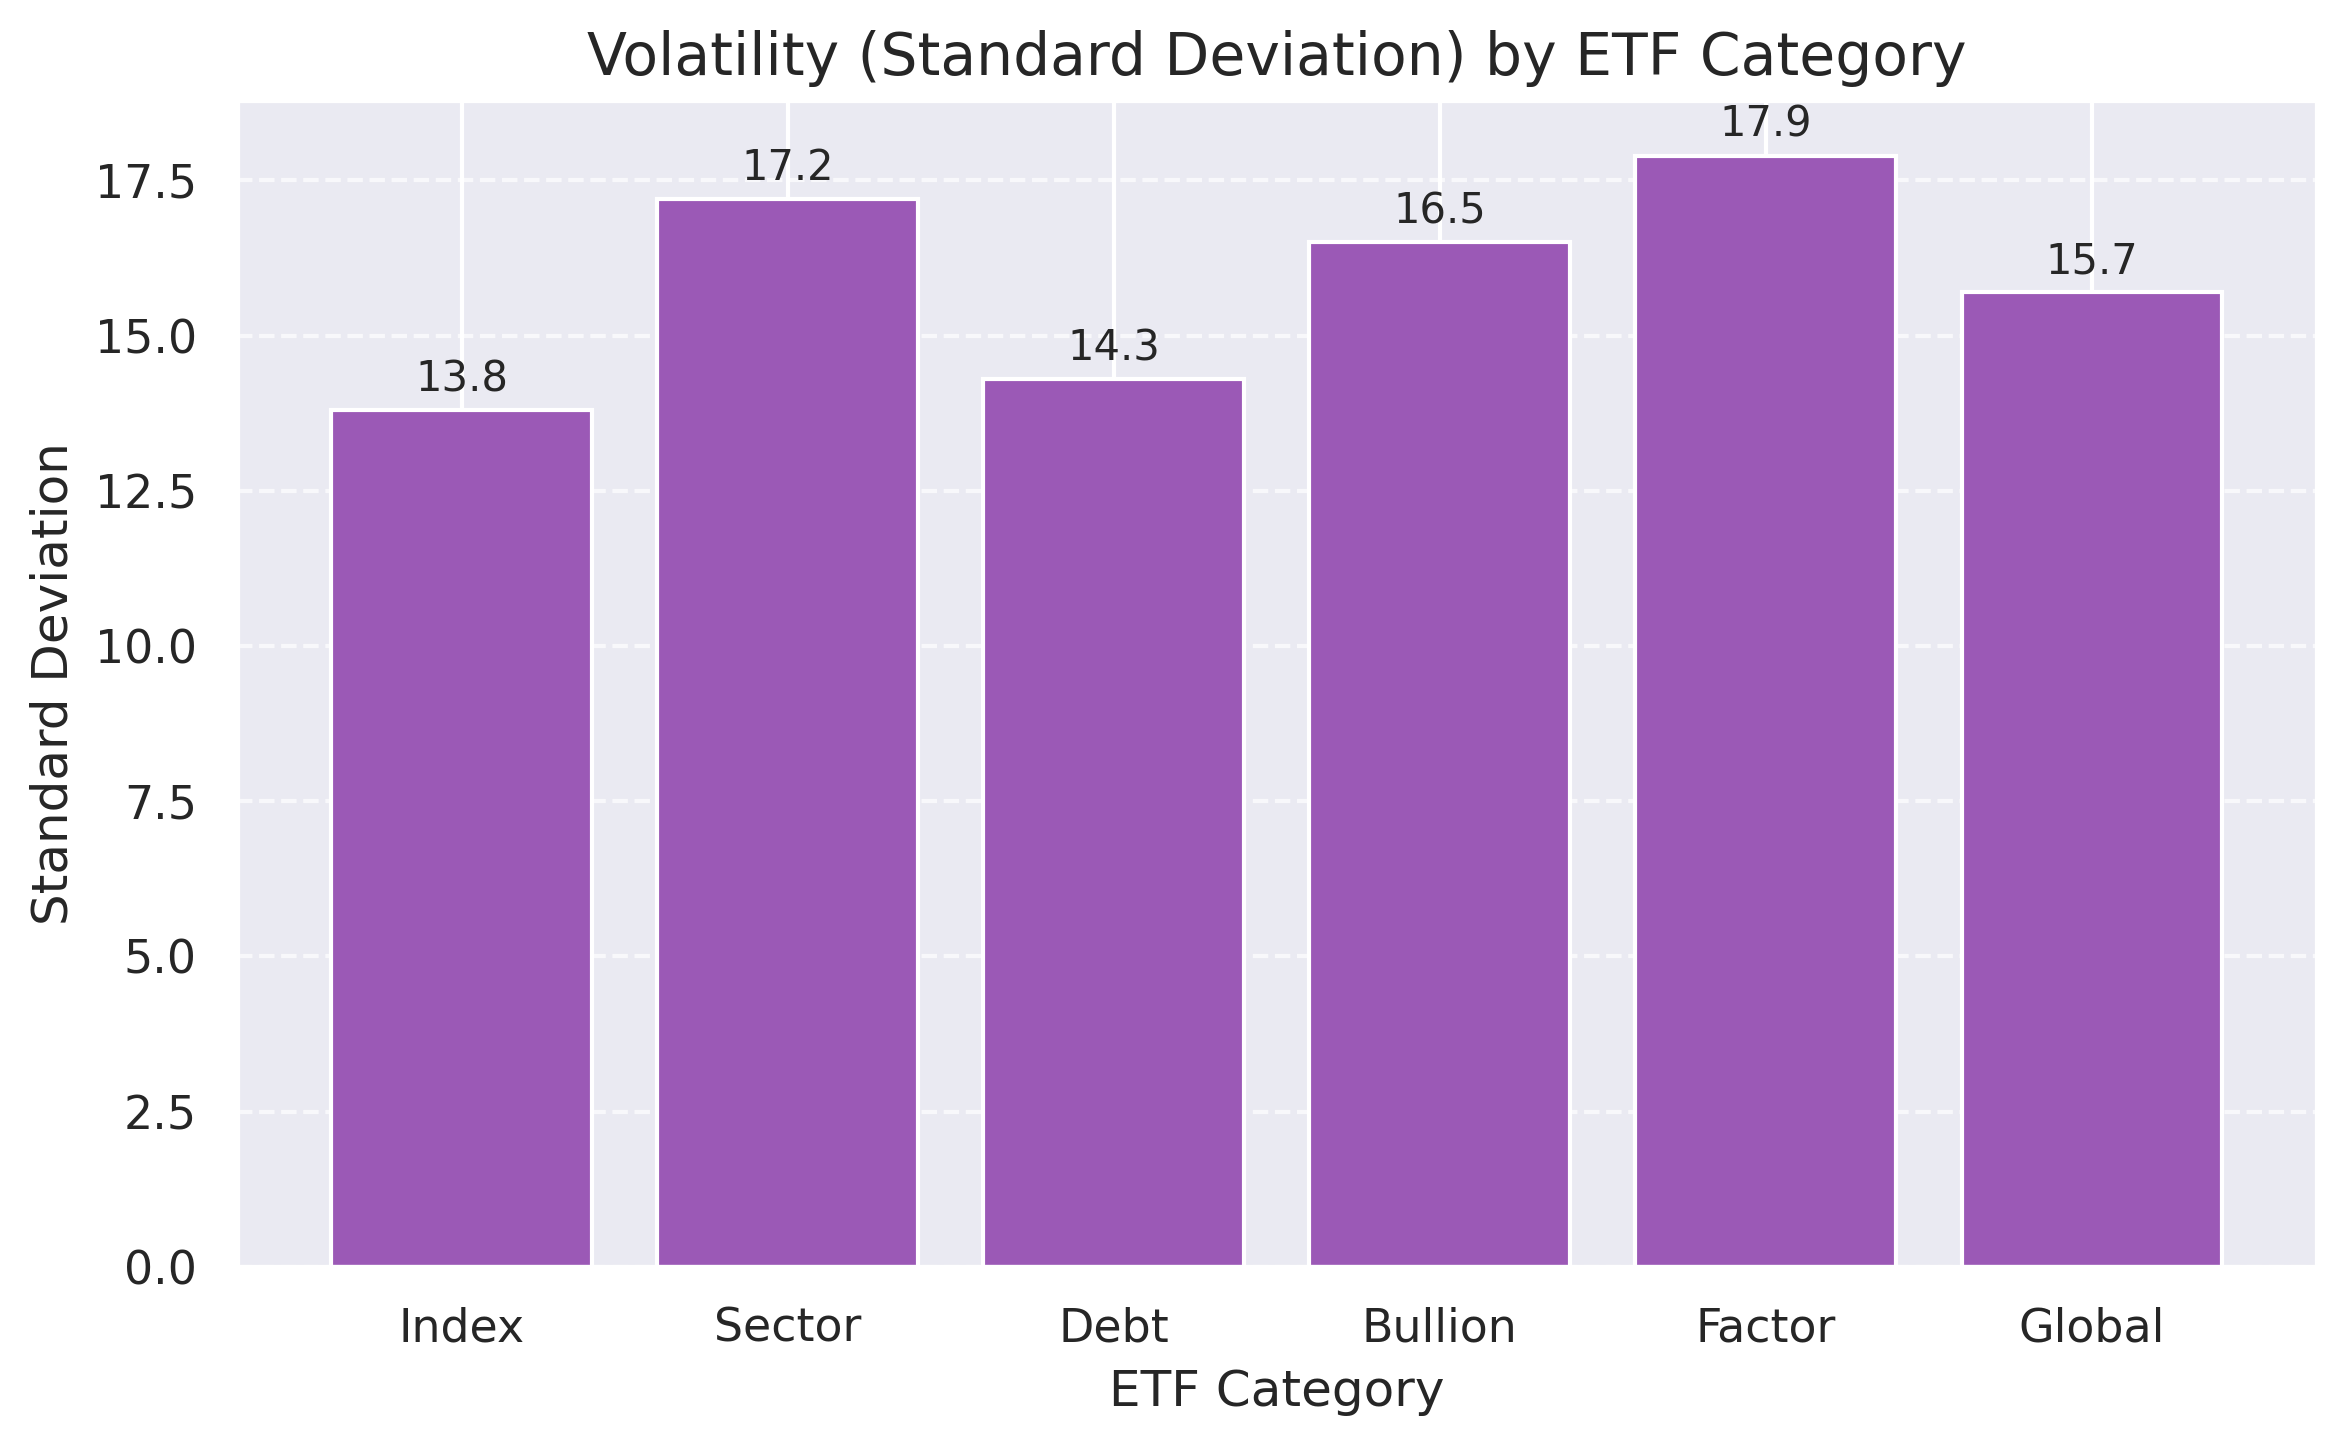
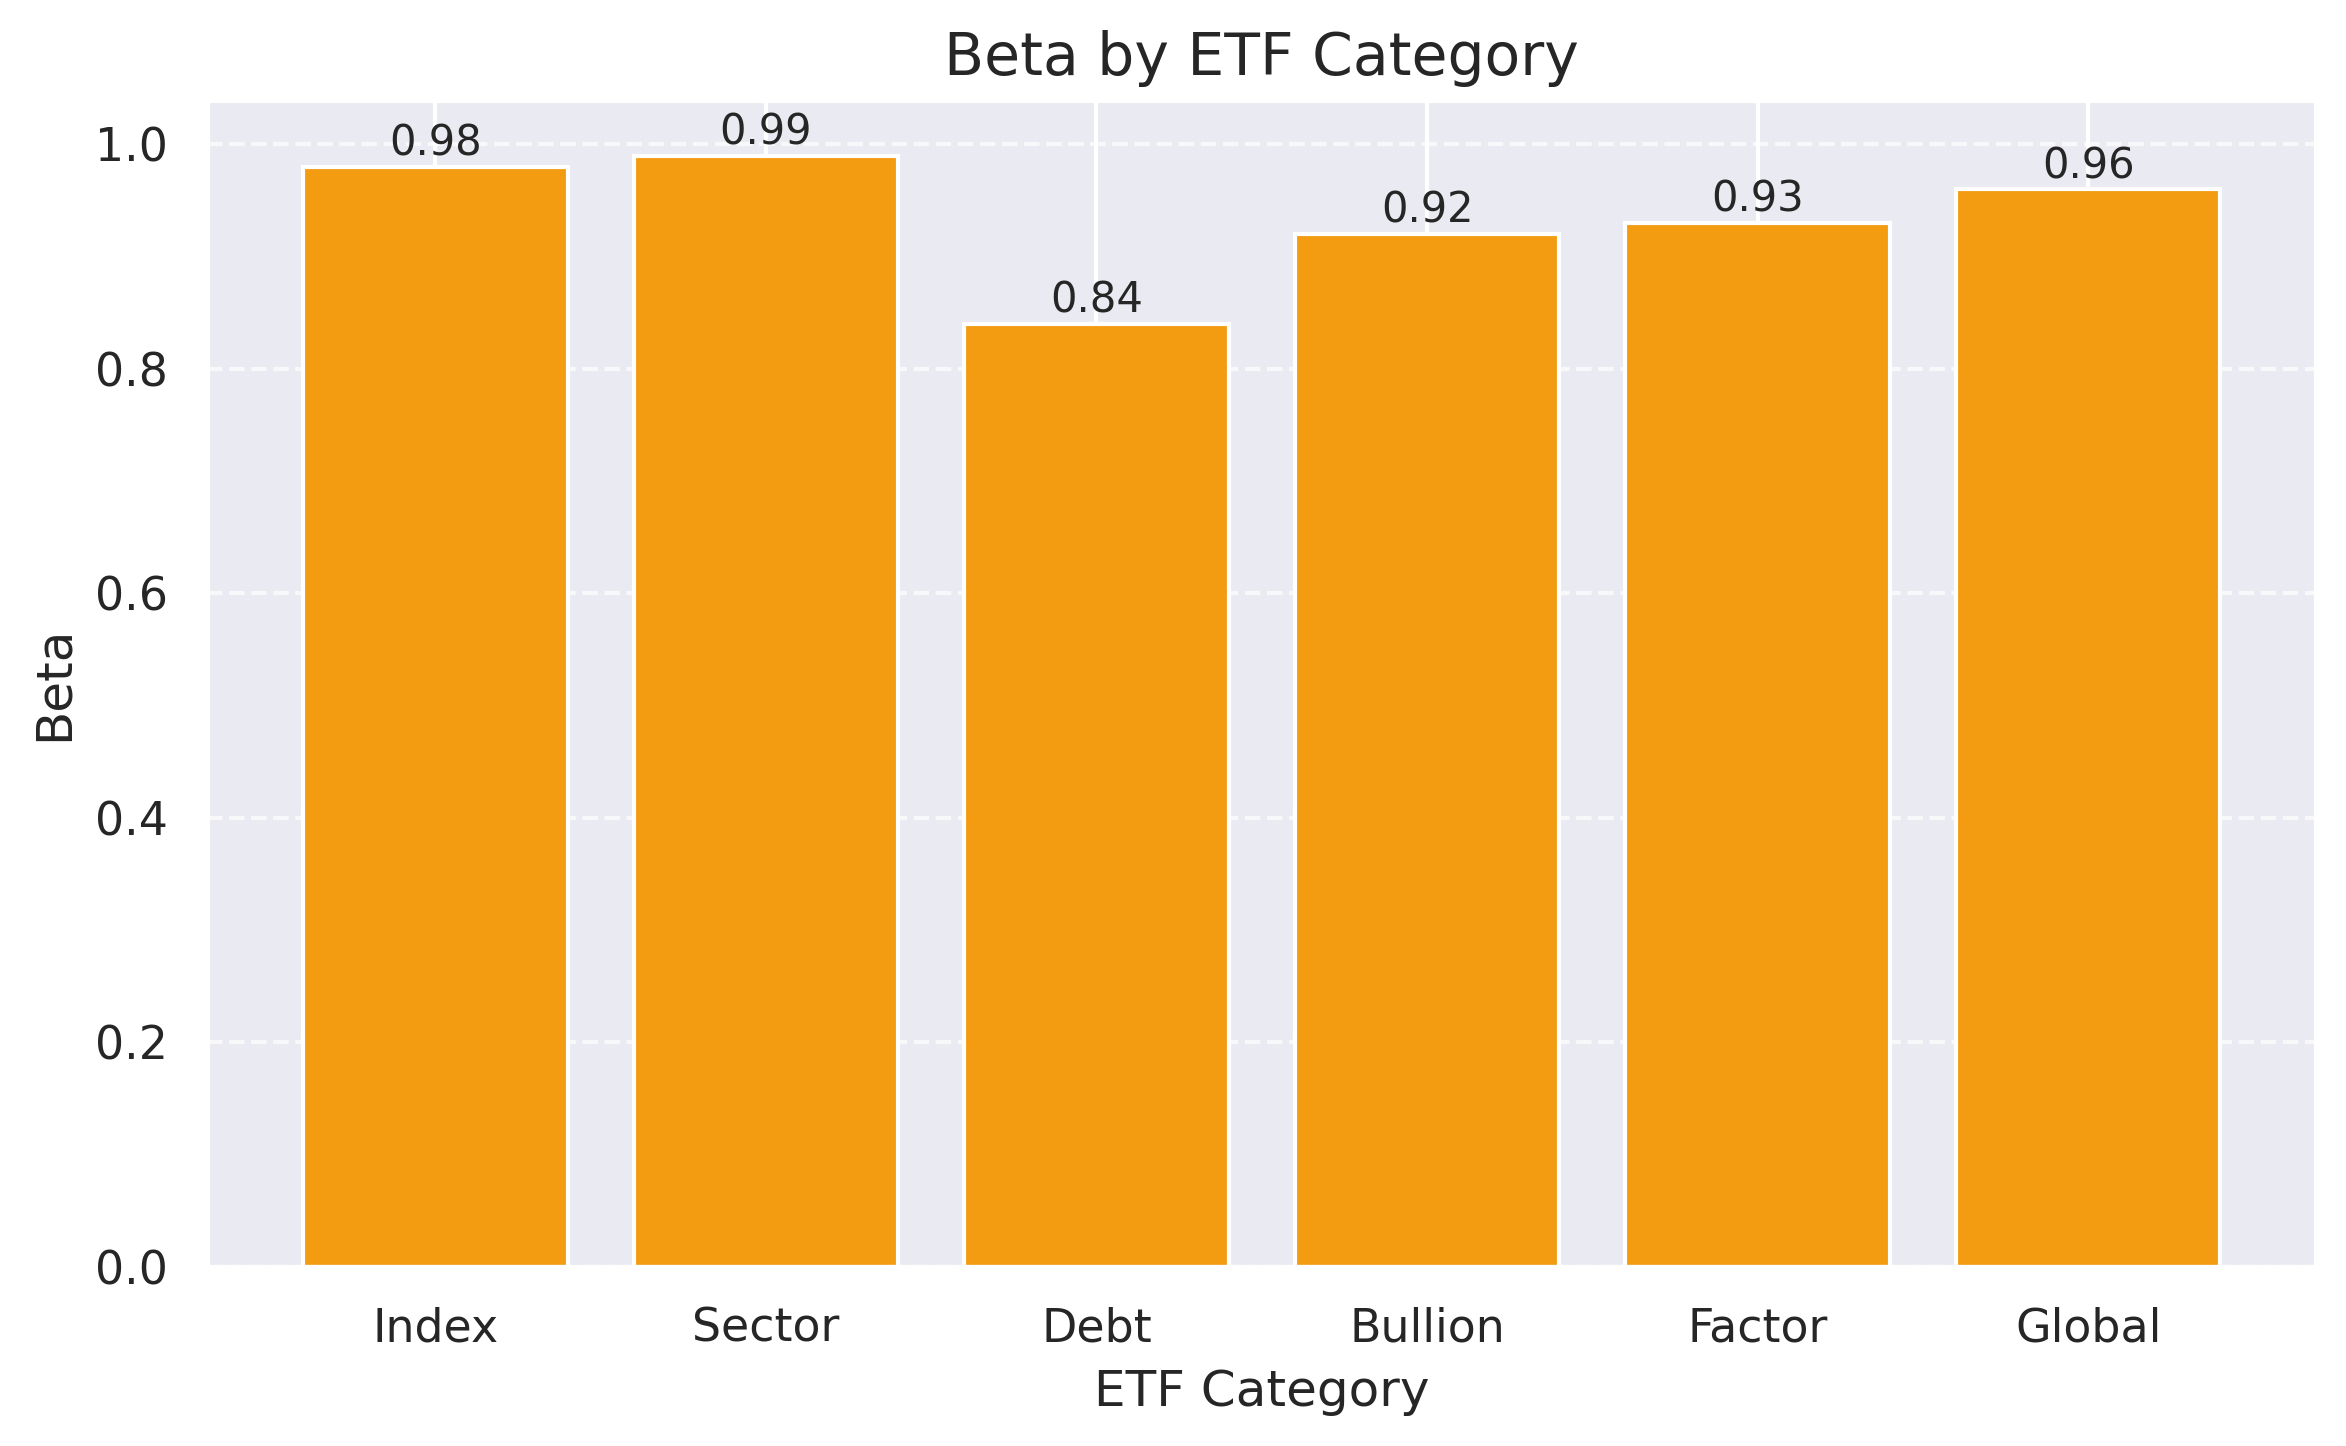
Key Observations:
- Index ETFs generally show beta values close to 1, indicating movement in line with the market
- Sector ETFs demonstrate higher volatility, reflecting sector-specific risks
- Debt ETFs show lower beta values, indicating reduced market sensitivity
- Factor ETFs exhibit varied risk profiles depending on their investment strategy
Risk Metrics by Category
| Category | Avg. Standard Deviation | Avg. Beta | Avg. Tracking Error |
|---|---|---|---|
| Index | 13.8 | 0.98 | 0.03% |
| Sector | 17.2 | 0.99 | 0.07% |
| Debt | 14.3 | 0.84 | 0.03% |
| Bullion | 16.5 | 0.92 | 0.17% |
| Factor | 17.9 | 0.93 | 0.30% |
| Global | 15.7 | 0.96 | 0.21% |
Top Performing ETFs
Based on our comprehensive analysis, here are some of the top-performing ETFs across different categories:
Index ETFs
Nippon India ETF Nifty 50
IndexICICI Prudential Nifty 50 ETF
IndexSector ETFs
Nippon India ETF Nifty Bank
SectorNippon India ETF Nifty IT
SectorBullion ETFs
Nippon India ETF Gold BeES
BullionICICI Prudential Gold ETF
BullionGlobal ETFs
Motilal Oswal NASDAQ 100 ETF
GlobalMirae Asset NYSE FANG+ ETF
GlobalInvestment Recommendations
Based on different investor profiles and objectives, here are our recommendations:
For Conservative Investors
Focus on capital preservation with stable returns
- Index ETFs: UTI Nifty 50 Index Fund, ICICI Prudential Nifty 50 ETF
- Debt ETFs: Nippon India ETF Nifty 1D Rate Liquid, ICICI Prudential Liquid ETF
- Allocation: 60% Debt ETFs, 40% Index ETFs
For Moderate Risk Investors
Balance between growth and stability
- Index ETFs: Nippon India ETF Nifty 50, HDFC Nifty 50 ETF
- Bullion ETFs: ICICI Prudential Gold ETF, Nippon India ETF Gold BeES
- Factor ETFs: ICICI Prudential Nifty 100 Low Volatility 30 ETF
- Allocation: 60% Index ETFs, 20% Bullion ETFs, 20% Factor ETFs
For Aggressive Investors
Focus on high growth potential with higher risk tolerance
- Sector ETFs: Nippon India ETF Nifty Bank, Nippon India ETF Nifty IT
- Global ETFs: Motilal Oswal NASDAQ 100 ETF, Mirae Asset NYSE FANG+ ETF
- Factor ETFs: Bandhan Nifty 200 Momentum 30 Index Fund
- Allocation: 40% Sector ETFs, 40% Global ETFs, 20% Factor ETFs